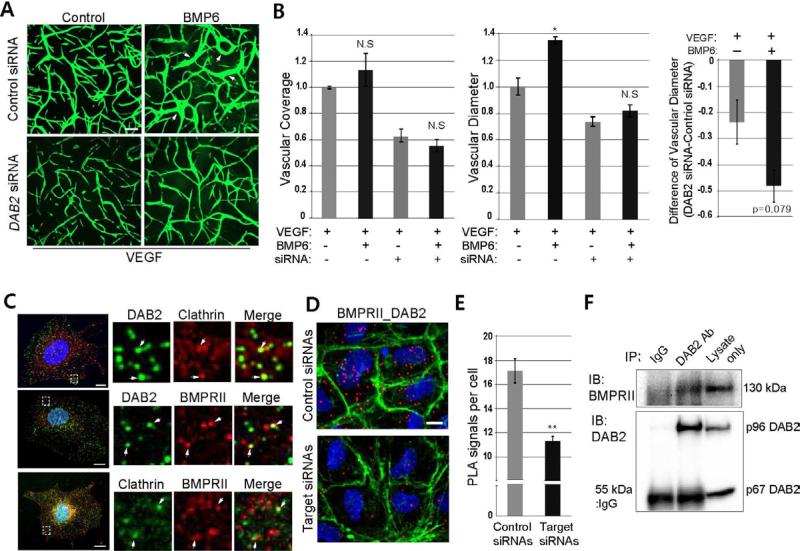
Figure 3. DAB2 interacts with BMP Type II receptor and Clathin.
(A) Representative images of control or DAB2 siRNA-treated HUVECs plated on Fibrin gel in the presence or absence of 50ng/ml of BMP6. Arrows point to vascular tube with an increased diameter. Scale bar is 200μm.
(B) Quantification of (A). Vascular coverage and diameter were evaluated by PRISM program. N=3 and *p<0.05. Error bar is s.e.m.
(C) Immunocytochemistry detecting DAB2, BMPRII, and Clathrin in HUVECs. Insets are taken from the areas within the rectangles in the left column. Arrows point to co-localization. Scale bar is 10μm. See also Figure S3A-S3C.
(D) Proximity Ligation Assay using antibodies against DAB2 and BMPRII in control (top) or DAB2/BMPRII siRNA-treated (bottom) HUVECs, counter-stained with DAPI (blue) and Phalloidin (green). Scale bar is 10μm. See also Figure S3D and S3E.
(E) Quantification of PLA signals of (D). N=3, and total number of images was 17 for control or target siRNA treatment. **p<0.005 and error bar presents s.e.m.
(F) Co-immunoprecipitation assay using DAB2 antibody. DAB2 antibody was able to pull down BMPRII from HUVEC lysate.

