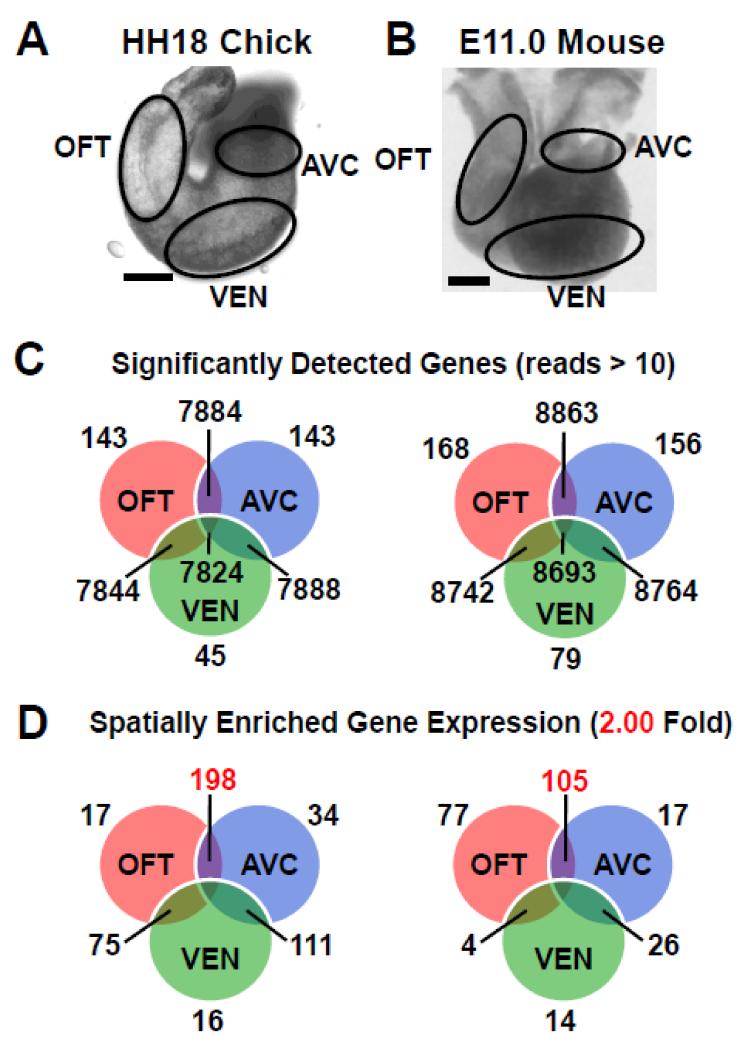
Figure 1. Spatial transcriptional profile of heart identifies cushion-enriched genes.
A-B, AVC, OFT and VEN were dissected from equivalent stages of chick HH18 (A) and mouse E11.0 (B). C, RNA-seq analysis identified genes with significantly expressed (>10 reads) in each spatial region of the developing heart tube. D, Mapping genes with enriched expression (>2-fold) onto each spatial region identifies those genes with cushion-enriched expression (in red), 198 in the chick and 105 in the mouse. Scale bars - 100μM.

