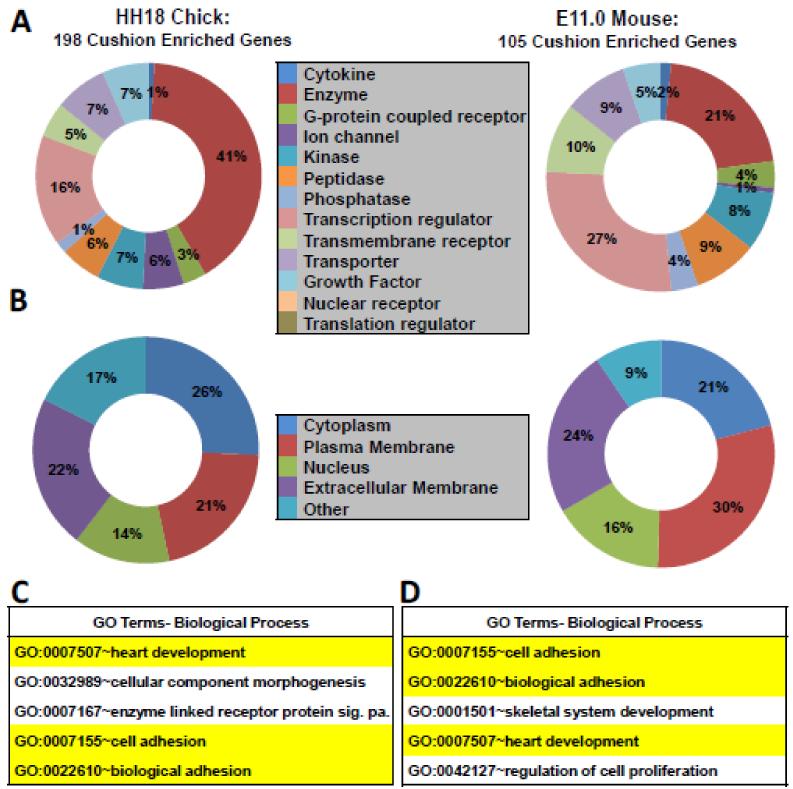
Figure 3. Gene ontology, predicted protein location, and protein function of cushion-enriched genes.
A, Predicted protein function of genes identified in the mouse and chick cushion-enriched gene lists generated using IPA software. Percent of total genes with defined function is depicted. Genes with unknown function in chick (89) and mouse (44) are not shown. B, Predicted protein location of genes identified in mouse and chick cushion using IPA software. C-D, Analysis of genes found >2-fold enriched in chick and mouse AVC and OFT using DAVID software. Selected significantly enriched biological processes (from DAVID BP-FAT) are depicted for chick and mouse (p<0.0001 for all terms). Significance was based on p-values generated by DAVID software[24]. Biological processes highlighted in yellow are shared between chick and mouse.

