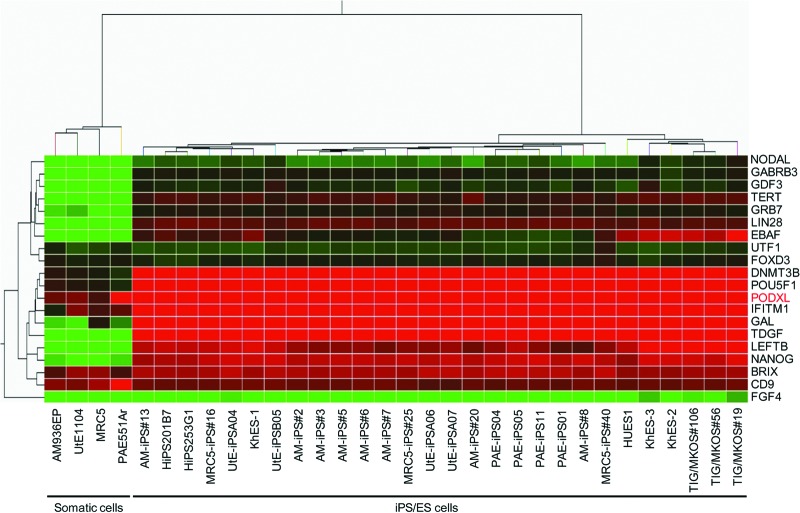
Figure 1.
Clustering of human stem cell markers versus cell lines. The heat map shows a two-way cluster analysis carried out on the data of the cell lines listed in supplemental online Table 1. The data were obtained as averages of multiple cell samples. Levels of gene expression are indicated by color changes from red (high expression levels) to green (low expression levels). Podocalyxin expression is indicated as “PODXL” in red. Abbreviations: ES, embryonic stem; iPS, induced pluripotent stem.

