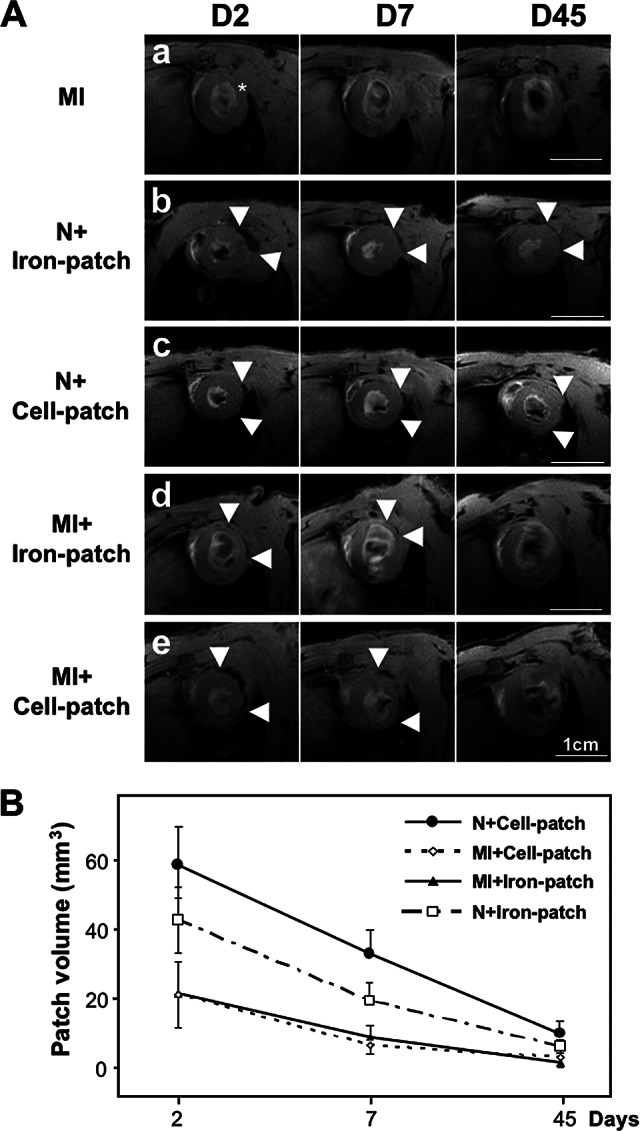
Figure 2.

Analysis of the cardiopatch degradation after transplantation onto infarcted rat hearts using magnetic resonance imaging (MRI) at days 2, 7, and 45. (A): MRI over time of fibrin cardiopatches containing either superparamagnetic iron oxide (SPIO) nanoparticles alone or SPIO-loaded mouse ESCs, after grafting onto the left ventricles. Scale bars = 1 cm. * indicates center of the infarcted area; arrowheads show the limits of the patch extension. (B): Quantitative analysis of patch volumes shows a decrease over time for the different patch conditions. Abbreviations: D, day; MI, myocardial infarction; N, normal.
