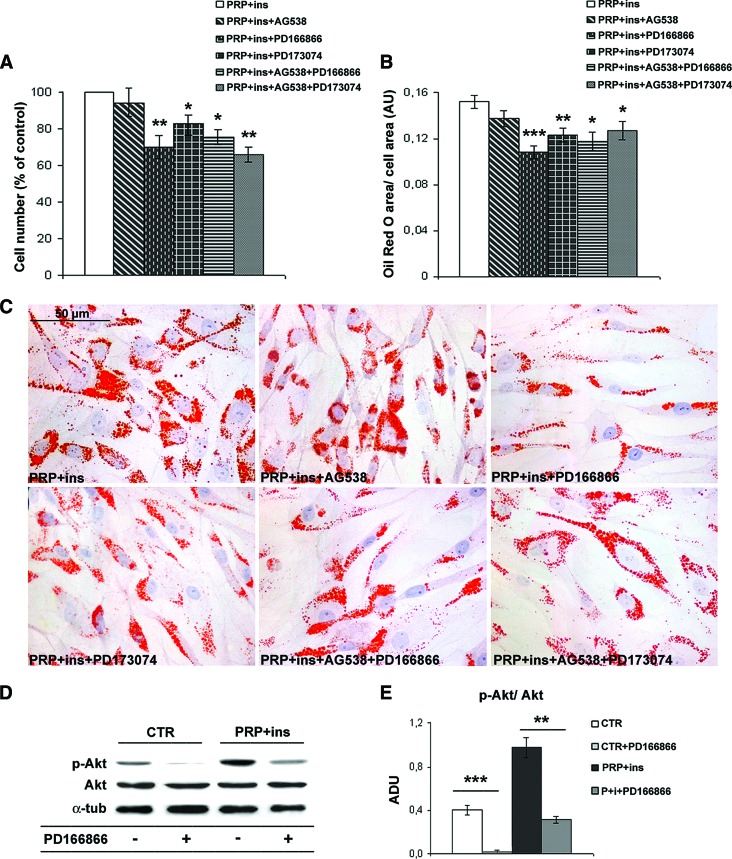
Figure 4.
Effects of specific fibroblast growth factor receptors and insulin-like growth factor receptor inhibitors on proliferation, adipogenic differentiation, and Akt phosphorylation in human adipose-derived stem cells. (A, B): Bar graphs showing cell number and intracytoplasmic lipid accumulation of ASCs after 6 days of exposition to PD166866 (100 nM), PD173074 (50 nM), and AG538 (10 μM) in the presence of 10% fetal bovine serum (FBS), PRP (5% vol/vol), and insulin (30 μM). Data are mean ± SE. (C): Representative Oil Red O staining micrographs of third passage ASCs treated with PD166866 (100 nM), PD173074 (50 nM), and AG538 (10 μM) in the presence of 10% FBS, PRP (5% vol/vol), and insulin (30 μM) for 6 days. Scale bar = 50 μm. (D, E): Representative blot (D) and densitometric analysis (E) of phosphorylated and total Akt expression in control, PRP + insulin, and FGFR-1 inhibitor (100 nM PD166866)-treated ASCs after 6 days. Data are mean ± SE. *, p < .05; **, p < .01; ***, p < .001. Abbreviations: ADU, arbitrary densitometric units; α-tub, α-tubulin; AU, arbitrary units; CTR, control; ins, insulin; p-Akt, phosphorylated Akt; PRP, platelet-rich plasma.

