Figure 1.
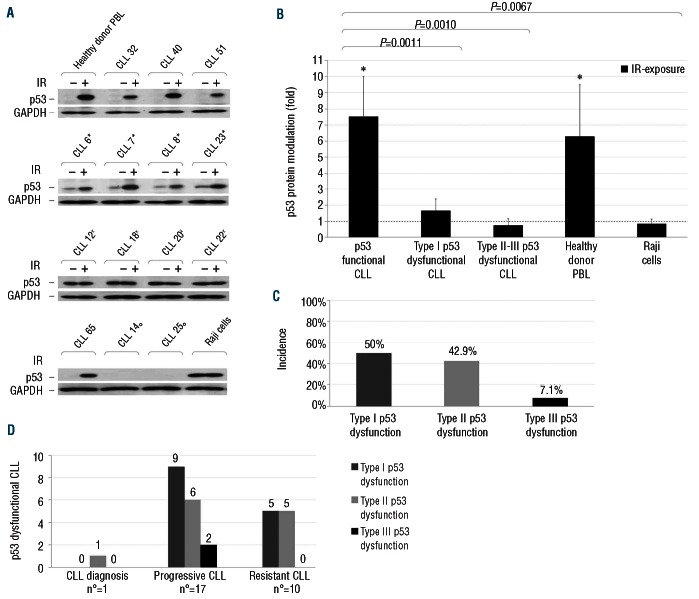
Detection of p53 dysfunctions in CLL patients. Irradiated and non-irradiated CLL cells were lysed after 8-h culture. Protein extracts were subjected to SDS-PAGE and Western blot analysis, as described in the Online Supplementary Design and Methods. (A) Representative results of: CLL showing a normal p53 function; CLL showing type I (asterisk), type II (dagger) and III (empty circle) p53 dysfunctions. Healthy donor PBL: negative control; Raji cells: positive control. GAPDH staining is shown as loading control. p53 and GAPDH images derive from different parts of the same gel. (B) Protein bands were quantified by densitometry and p53 protein levels were expressed as folds of protein modulation by IR-exposure, with respect to the control culture set to 1 (hatched line) after normalization to GAPDH. Asterisks indicate P<0.05 (Student’s t-test) against control. Results for 31 p53 functional CLL samples, 14 type I, 12 type II, 2 type III p53 dysfunctional CLL samples, 10 healthy donor PBL samples and Raji B-cell line samples from 10 independent experiments. (C) Distribution of the different types of p53 dysfunctions in the totality of CLL dysfunctional patients (n=28). (D) Distribution of the different types of p53 dysfunctions in CLL dysfunctional patients according to their disease phase.

