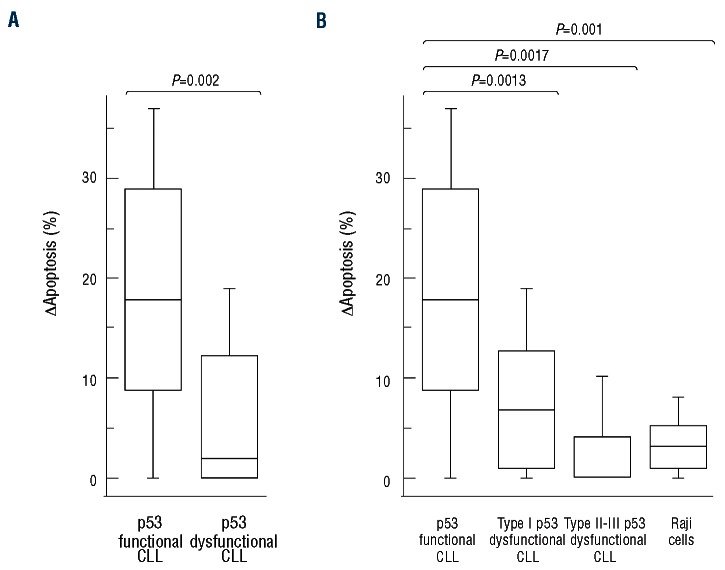
Figure 3.
IR-induced cytotoxicity in CLL cells. Comparison of the changes in apoptosis [∆apoptosis = (IR-induced apoptosis) – (spontaneous apoptosis)] between p53 functional and p53 dysfunctional CLL samples considered either totally (A) or divided according to the type of dysfunction (B). Lymphoid cells were exposed to 5Gy IR and the induction of apoptosis was calculated as percentage of AnnV+/PI- and AnnV+/PI+ cells after 24-h culture. Results for 31 p53 functional CLL samples, 14 p53 dysfunctional CLL samples (8 type I, 4 type II and 2 type III p53 dysfunctions) and Raji B-cell line samples from 10 independent experiments. Box plots define the median values, 25% to 75% of values around the median and the range of values. The corresponding P values (Student’s t-test) are reported.

