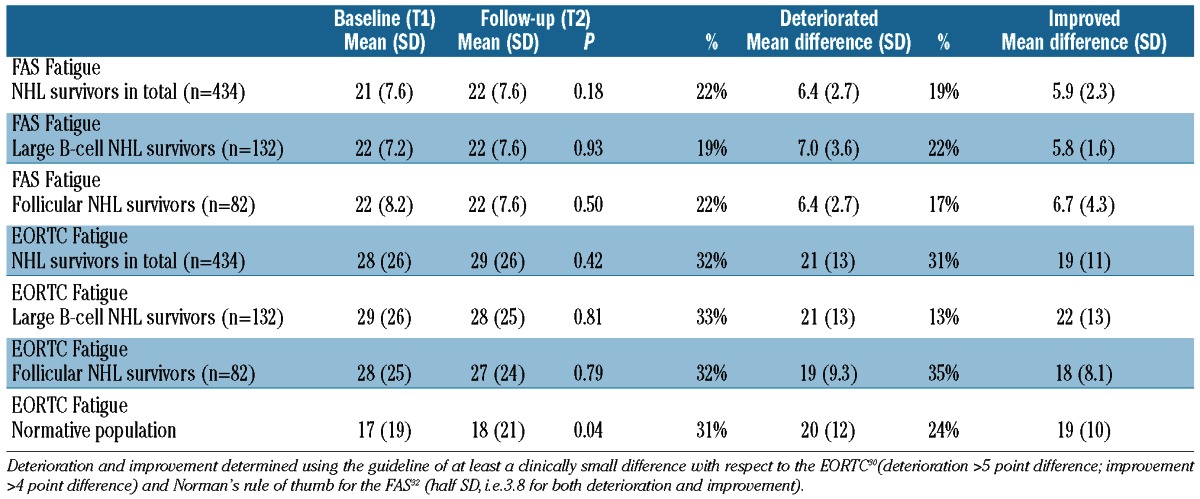
Table 3.
Mean fatigue scores (SD) at baseline (T1) and follow-up (T2) among NHL survivors and respondents of the normative population who completed two questionnaires (NHL survivors; n=434; normative population, n=515), and percentages of patients/respondents who deteriorated/improved between these time points (mean difference and SD).

