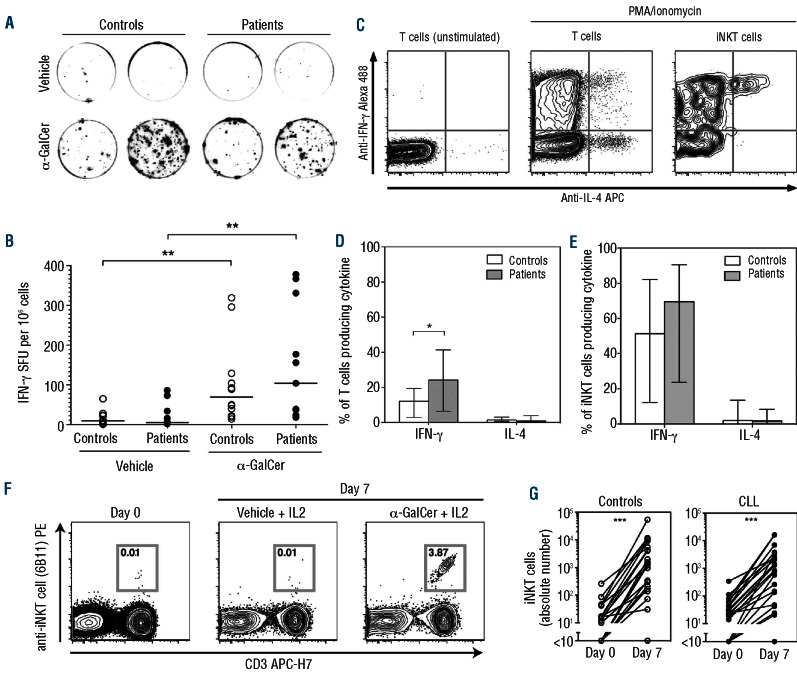
Figure 3.
Function of circulating iNKT cells from patients with CLL. (A) Representative interferon (IFN)-g ELISpot formation from two controls and two patients with CLL, in response to vehicle or α-GalCer. (B) α-GalCer-induced IFN-γ production assessed by ELISpot on B-cell-depleted PBMC from untreated patients (n=11) and healthy controls (n=12). Bars represent medians (**P<0.01; differences between controls and patients not significant). (C) Representative intracellular cytokine staining for IFN-γ and interleukin (IL)-4, gated separately on T cells and on iNKT cells. (D) Intracellular cytokine expression of T cells from patients with CLL (n=11) and healthy controls (n=11). Bars represent medians, error bars represent quartiles (*P<0.05). (E) Intracellular cytokine expression of iNKT cells from patients with CLL (n=11) and healthy controls (n=11). Bars represent medians, error bars represent quartiles (differences not significant). (F) Representative flow cytometry plots showing iNKT cell proliferation in response to α-GalCer and IL-2. Numbers represent percentage of CD19- lymphocyte events lying within the iNKT cell gate. (G) In vitro proliferation of iNKT cells from healthy controls (n=20) and patients (n=20) (***P<0.001).

