Figure 4.
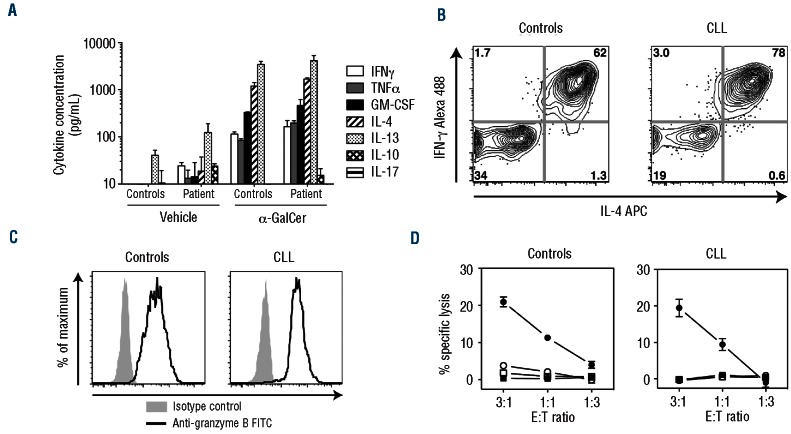
Patient-derived iNKT cell lines exhibit normal cytokine production and cytotoxicity. (A) Supernatant cytokine levels following 24h culture of patient-derived or control-derived iNKT cell lines with CD1d-transfected C1R cells in the presence of vehicle or α-GalCer. (B) Representative flow cytometry plots showing intracellular interferon (IFN)-g and interleukin (IL)-4 expression of a patient- and a control-derived iNKT cell line. (C) Representative flow cytometry histograms showing granzyme B expression by a patient- and a control-derived iNKT cell line. (D) Cytotoxicity of a patient- and control-derived iNKT cell line against C1R target cells, as determined by lactate dehydrogenase release. Filled circles: CD1d-transfected C1R targets plus α-GalCer. Hollow circles: CD1d-transfected C1R targets plus vehicle. Filled squares: untransfected C1R targets plus α-GalCer. Hollow squares: untransfected C1R targets plus vehicle. Error bars represent the standard error of three replicates.

