Figure 1.
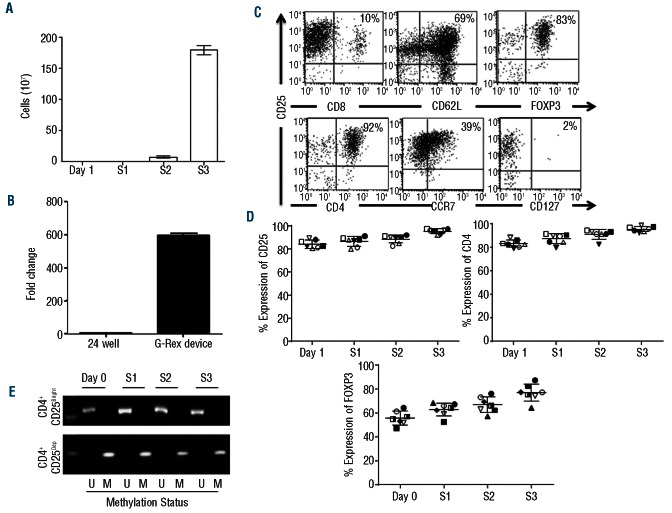
Robust ex vivo expansion of nTregs in the G-Rex device. (A) illustrates the number of nTregs obtained after 1, 2 or 3 (S1, S2 and S3) weeks of culture in the G-Rex device. Data illustrate average and standard deviations (SD) for 7 independent experiments. (B) Compares the fold expansions of nTregs cultured in 24-well plates or in the G-Rex device. Data show mean ± SD of 7 independent experiments. (C) Shows the flow cytometry plots of expanded nTregs on Day 21 (S3). The panels illustrate CD4, CD25, CCR7, CD127 and FoxP3 expression for one representative donor. (D) Illustrates the expression of CD25, CD4 and FoxP3 in expanded nTregs after each round of stimulation (S1, S2 and S3). Data summarize the results of 7 independent experiments. (E) Shows the methylation-specific semi-quantitative PCR of the FoxP3 promoter in nTregs and control CD25Dep cells obtained after each round of stimulation (S1, S2 and S3).

