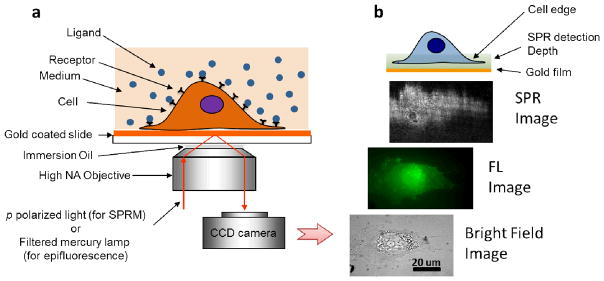
Fig. 1. Surface plasmon resonance microscopy (SPRM).

(a) Schematic illustration of the experimental setup. A p-polarized laser beam is directed onto a gold-coated glass coverslip via an oil immersion objective to create surface plasmon resonance (SPR) on the gold surface, which is imaged with a CCD camera. A mercury lamp and appropriate optical filters are used to perform epifluorescence measurements. Conventional bright field images of the same sample can also be taken via illumination from the top of the sample. Cells to be studied are cultured on the coverslip. (b) From bottom to top, example of bright field, fluorescence and SPR images of a cell stained by Alexa Fluor 488 labeled wheat germ agglutinin (WGA). The top cartoon illustrates that the entire cell bottom membrane and partial cell top membrane in the cell edge regions are located within the typical detection depth of the present SPRM.
