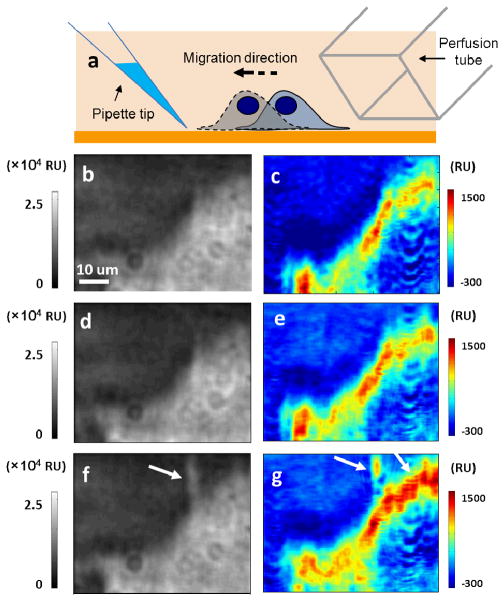
Fig. 4. Glycoprotein polarization during chemotaxis.
(a) A micropipette tip filled with fetal bovine serum is located near the target cell and induce the cell migration towards the chemoattractant. Another perfusion tube is located at the other side of the cell and introduces the WGA solution in order to obtain the distribution map of glycoprotein. The SPRM (b, d, f) and distribution images (c, e, g) were obtained in the beginning (b, c), after 20 minutes waiting without any treatment (d, e) and at another 20 minutes after the chemoattractant was applied (f, g), respectively.

