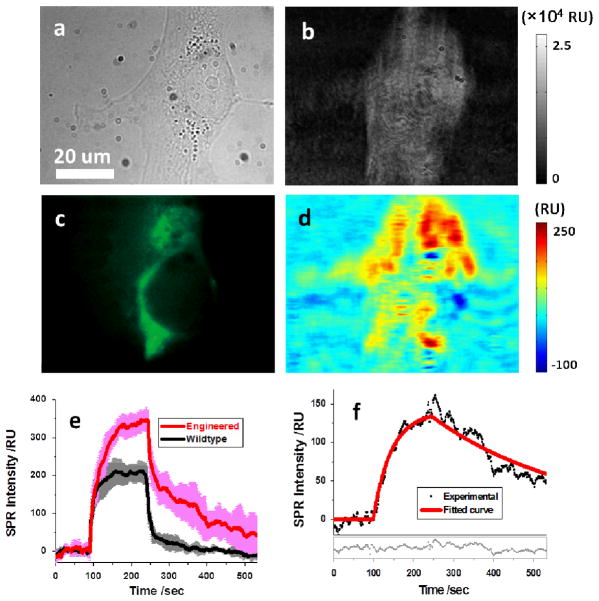
Fig. 5. Mapping nicotinic acetylcholine receptors (nAChR).
(a) and (b) Bright field and SPRM images of an engineered SH-EP1 cell that expresses nAChR receptors. (c) The immunofluorescence image of the same cell obtained by sequentially incubating with primary and Alexa Fluor 488 labeled secondary antibody. (d) Distribution of nAChR of the same cell resolved via the binding of primary antibody to the cell. (e) SPR sensorograms of engineered (red curve) and wildtype (black curve) SH-EP1 cells during primary antibody binding. Five cells were examined in each case and variation is shown by the pink and grey curves. (f) The sensorogram (black dots) after the correction of bulk refractive index effect (by taking the wildtype as reference), where the red curve is fitting the first-order kinetics model. The fitting residuals are shown in the lower portion of the figure.

