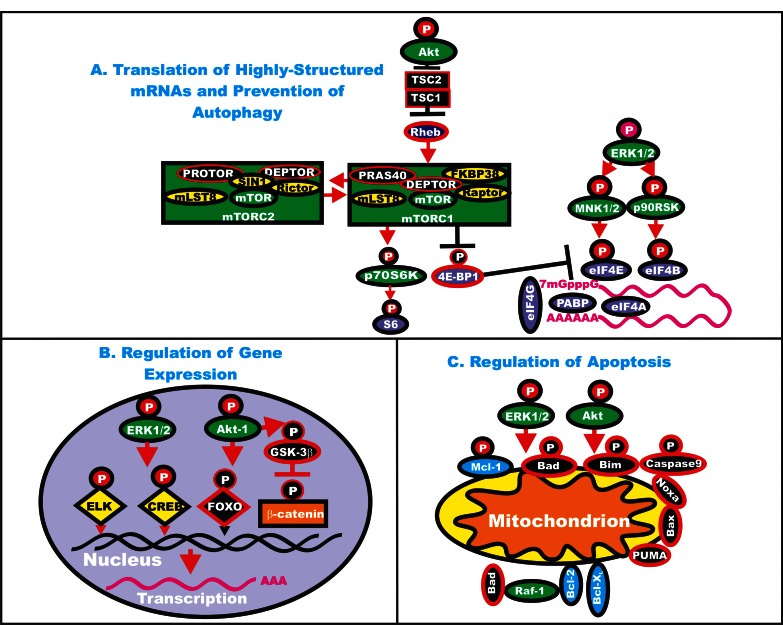
Figure 3. Effects of ERK and Akt on Regulatory Processes.
ERK and Akt can phosphorylate many targets which serve to regulate cell proliferation. In Panel A, some of the effects of ERK and Akt on the translation of highly structured mRNAs are indicated. Kinases are indicated in green ovals or rectangles (mTORC1 and mTORC2 complexes). TSC1 and TSC2 are indicated in black squares. Rheb is indicated in a dark blue oval. mTOR interacting proteins which positively regulate mTOR activity are indicated in yellow ovals. mTOR interactiving proteins which negatively regulate mTOR activity are indicated in black ovals. mRNA initiation factors and proteins associated with the ribosome are indicated in purple ovals. In Panel B, some of the effects on the regulation of gene expression by ERK and Akt phosphorylation are indicated. Transcription factors activated by either ERK or Akt phosphorylation are indicated in yellow diamonds. The Foxo transcription factor that is inactivated by Akt phosphorylation is indicated by a black diamond. Beta-catenin is indicated in an orange rectangle. In Panel C, some of the effects of ERK and Akt phosphorylation on apoptotic regulatory molecules are indicated. Molecules such as Mcl-1 which are anti-apoptotic and phosphorylated by ERK and Akt are indicated by blue ovals, other anti-apoptotic molecule are also indicated by blue ovals. Pro-apoptotic molecules are indicated by black ovals. Red arrows indicate activating events in pathways. Black arrows indicate inactivating events in pathway. Activating phosphorylation events are depicted in red circles with Ps with a black outlined circle. Inactivating phosphorylation events are depicted in black circles with Ps with a red outlined circle.

