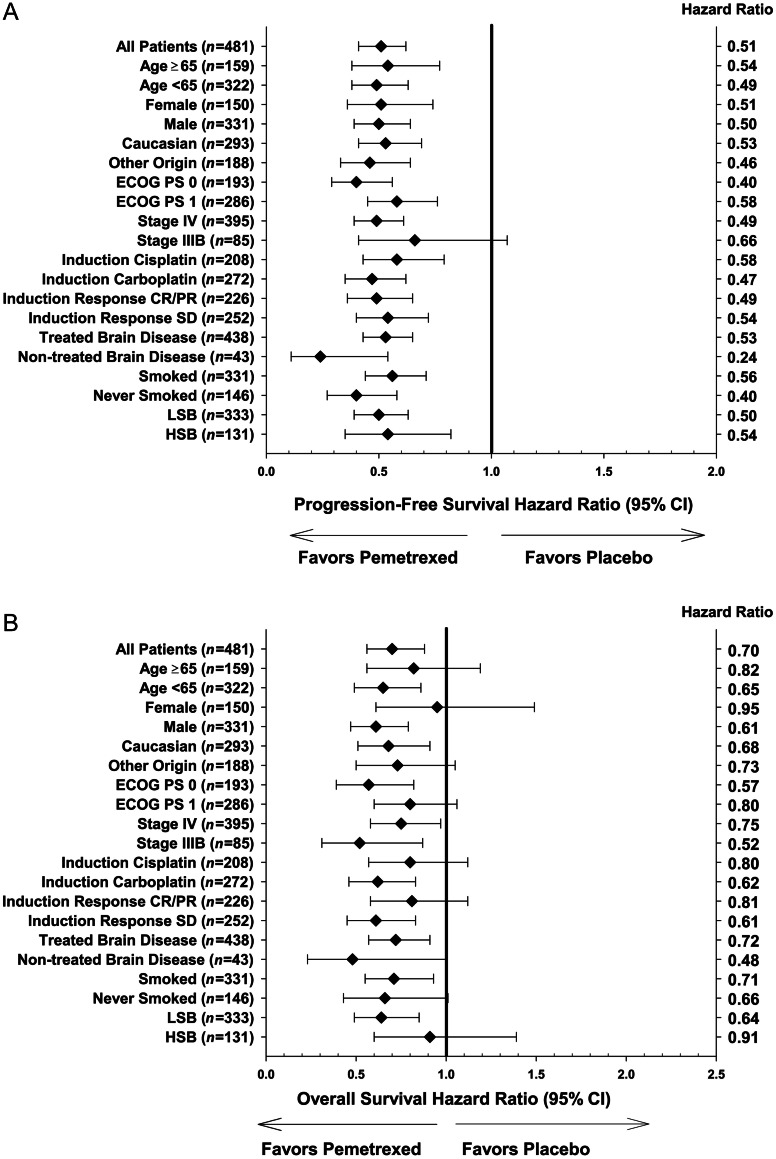
Figure 1.
PFS (A) and OS (B) HR (pemetrexed versus placebo) by clinical and demographic subgroups for patients with non-squamous histology (n = 481). n, number of patients in each subgroup; ECOG, Eastern Cooperative Oncology Group; PS, performance status; CR, complete response; PR, partial response; SD, stable disease; LSB, low symptom burden; HSB, high symptom burden.

