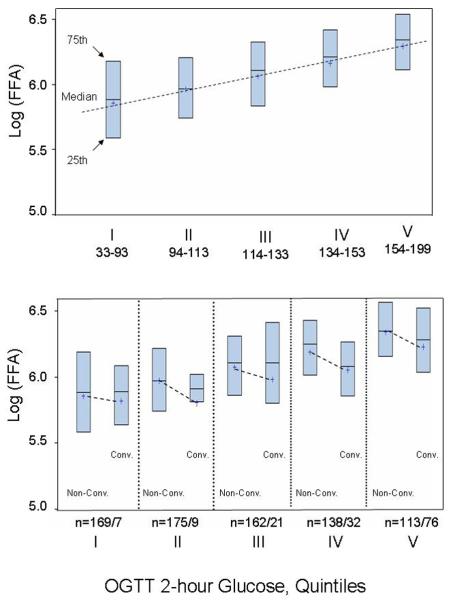
Figure 1.
Distribution of fasting NEFA levels by quintiles of OGGT 2-hour glucose at baseline of the IRAS: boxes' indicate 25th and 75th percentiles; horizontal lines within boxes depict medians; “+” indicate mean values within subgroups; dashed lines emphasize the differences between the mean values.

