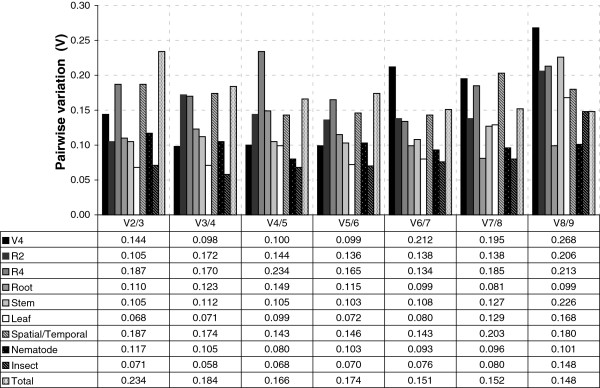
Figure 2.

Pairwise variation (V) analysis of the candidate reference genes as predicted by geNorm. The Pairwise variation (Vn/Vn+1) was analyzed using the normalization factors NFn and NFn+1 to determine the optimal number of reference genes required for effective normalization of qPCR data.
