
Figure 3.
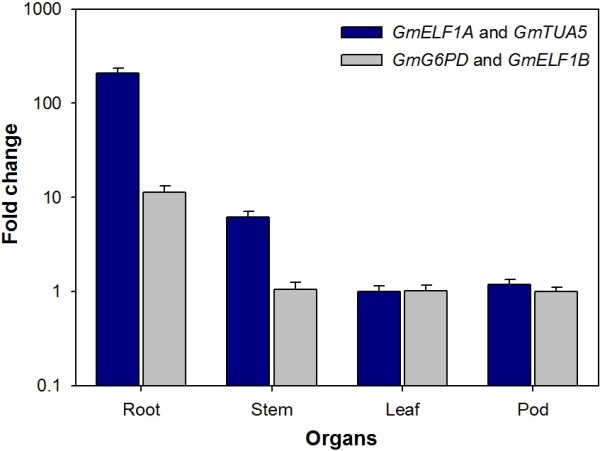
Relative quantification of GmRB7 expression in different organs. The root-specific aquaporin GmRB7 transcript quantification was determined in different plant organs at the R4 stage normalized with the most stable pair of reference genes GmELF1A and GmTUA5 (Blue) and with the least stable pair of reference genes GmG6PD and GmELF1B (Gray), determined by geNorm. GmRB7 expression in different organs was calculated relative to leaf. The Y-axis represents relative expression values in fold change. The bars represent standard deviations.