
Figure 2.
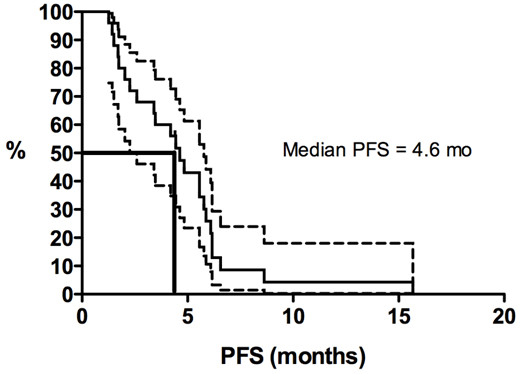
Kaplan-Meier curves for progression-free survival duration (PFS) in patients with advanced solitary fibrous tumors who were treated with conventional chemotherapy (all lines of chemotherapy combined). Y-axis represents the proportion of living patients without disease progression.