
Figure 3.
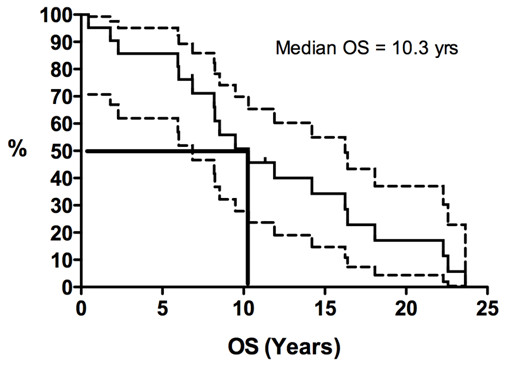
Kaplan-Meier curves for overall survival duration (OS) from the time of diagnosis in patients with advanced solitary fibrous tumors who were treated with conventional chemotherapy. Y-axis represents the proportion of living patients.
Official websites use .gov
A
.gov website belongs to an official
government organization in the United States.
Secure .gov websites use HTTPS
A lock (
) or https:// means you've safely
connected to the .gov website. Share sensitive
information only on official, secure websites.
Kaplan-Meier curves for overall survival duration (OS) from the time of diagnosis in patients with advanced solitary fibrous tumors who were treated with conventional chemotherapy. Y-axis represents the proportion of living patients.