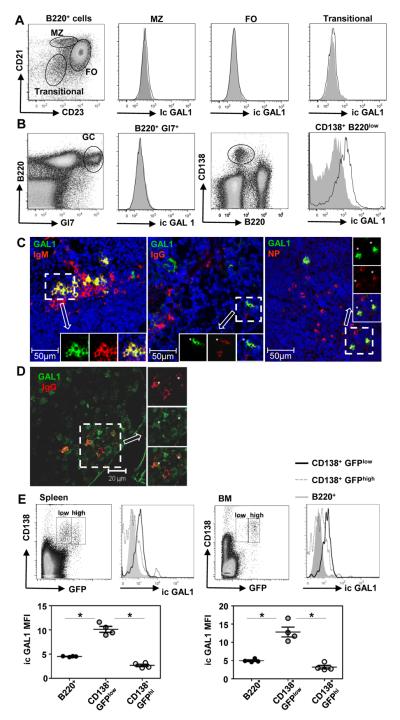
Figure 1. GAL1 is expressed by plasmablasts.
Spleen cells from non-immunized mice (A) and mice immunized with a T-dependent antigen (NP-KLH) at day 21 (B) were stained for cell surface expression of B220, CD21, CD23, GL7 and CD138 and for intra-cytoplasmic expression of GAL1 and analyzed by flow cytometry. B220+CD21+CD23high follicular (FO), B220+CD21highCD23low marginal zone (MZ), B220+CD21−CD23− early transitional and B220+GL7+ germinal center (GC) B cells and B220lowCD138+ plasma cells (PC) are indicated. Cells from Lgals1−/− mice were similarly stained and used as negative controls for GAL1 expression. Histograms for Lgals1−/− and WT mice are filled in grey and white, respectively. Data are representative of more than 5 independent experiments with at least 4 mice per group. (C) Immunohistofluorescence was done on spleen sections of mice immunized with a T-independent antigen (NP-Ficoll), 7 days after injection. Anti-GAL1, anti-IgM, anti IgG and NP-PE staining were also performed. A representative extra-follicular zone (low nuclei density) of the spleen is shown. Images are representative of more than 5 different fields from 5 immunized mice. GAL1 is in green, IgM, IgG and NP in red and nuclei in blue (D) Immunohistofluorescence was done on bone marrow sections of mice immunized with a T-dependent Ag (NP-KLH), 8 days after the secondary injection. Anti-GAL1 and anti-IgG staining were performed and a representative field of the bone marrow is shown. GAL1 is in green and IgG in red. Asterisks show double-stained cells. The image is representative of 3 different fields from 2 immunized mice. (E) Spleen (left top panel) and bone marrow (right top panel) cells from NP-KLH immunized Blimp1gfp mice at day 15, were stained with anti-GAL1, anti-CD138 and anti-B220. The mean fluorescence intensity (MFI) of GAL1 staining for B cells (B220+), PBs (CD138+GFPlow) and fully differentiated PCs (CD138+GFPhigh) in the spleen (left lower panel) and bone marrow (right lower panel) are shown. The legend of the histograms is indicated on the Figure. Data are representative of 2 independent experiments with 4 mice per group.
* indicates significance between conditions with p<0.05.

