
Figure 3.
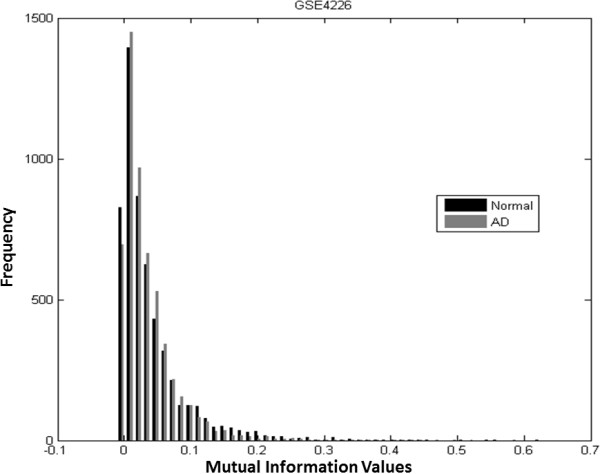
Histograms of pairwise MI values of normal and AD samples of GSE4226.
Official websites use .gov
A
.gov website belongs to an official
government organization in the United States.
Secure .gov websites use HTTPS
A lock (
) or https:// means you've safely
connected to the .gov website. Share sensitive
information only on official, secure websites.
Histograms of pairwise MI values of normal and AD samples of GSE4226.