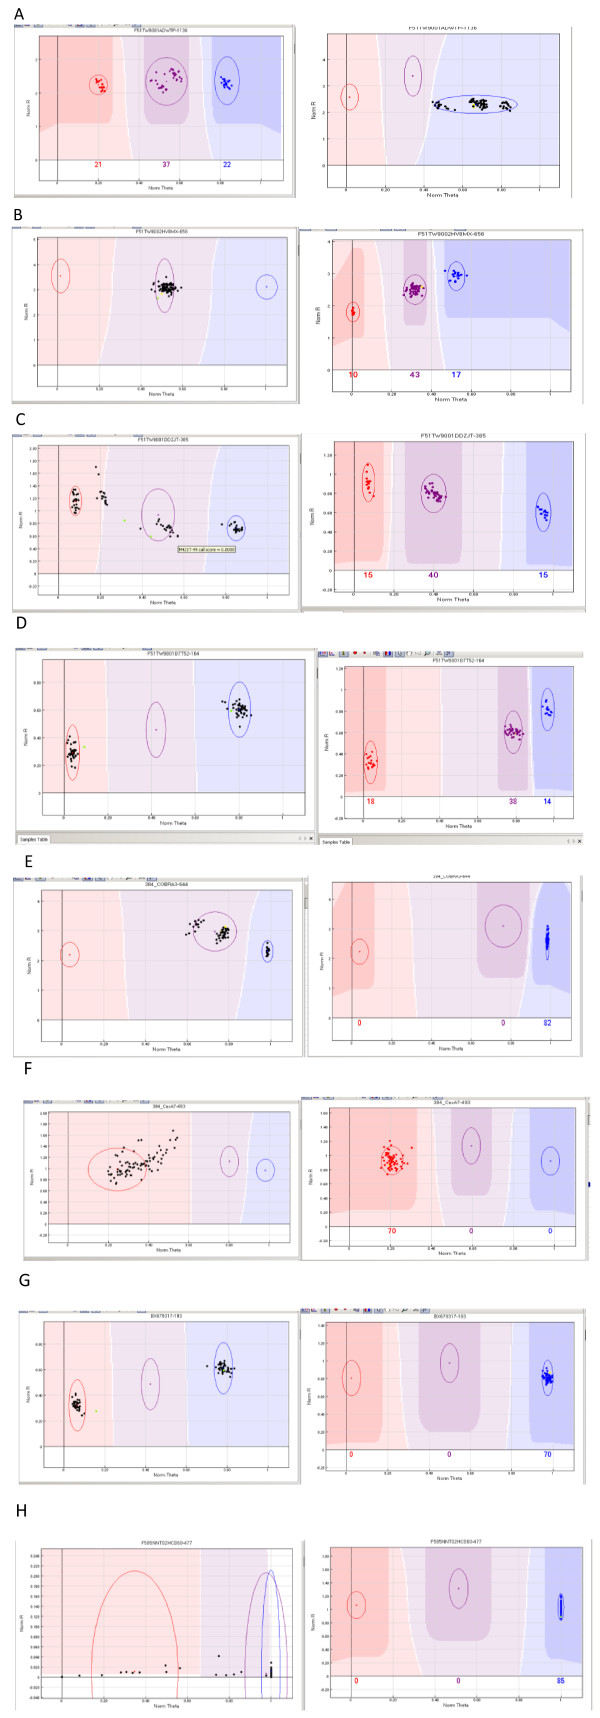
Figure 1.
Illustration of loci giving inconsistent results in the two mapping populations studied (F2 and G2): A, B, C, D polymorphic versus failed; E, F, G, H monomorphic versus failed. Counts for each class are available in Additional file 1. x-axis (norm Theta; normalized Theta) is ((2Π)Tan-1(Cy5/Cy3)). Values close to 0 indicate homozygosity for one allele and values close to 1 indicate homozygosity for the alternative allele. y-axis (NormR; Normalized R) is the normalized sum of intensities for the two dyes (Cy3 ad Cy5).

