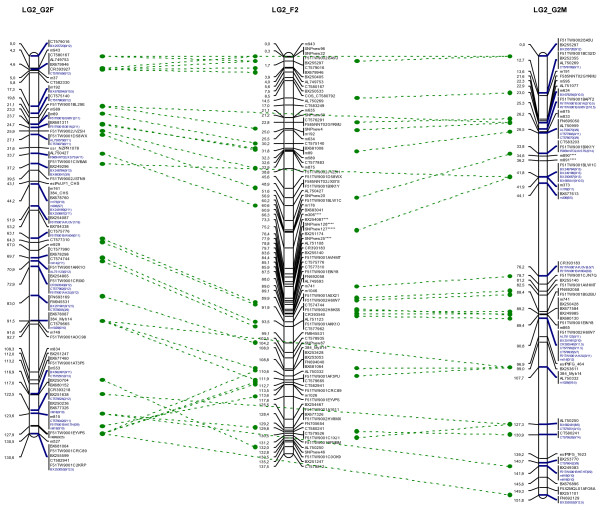
Figure 2.
Example of linkage group (LG2) obtained from segregation data for the G2 and F2 mapping populations. Markers common to the G2 female (G2F), G2 male (G2M) and F2 maps are linked by green dashed lines. Framework markers (segregating in a 1:1 ratio) are indicated in black, whereas accessory markers (segregating in a 1:2:1 ratio) are indicated in blue followed, in brackets, by the distance (in cM) to the nearest framework marker and the corresponding LOD score. Markers displaying segregation distortion in the initial dataset are indicated with an asterisk (*). The whole map is available in Additional file 3. LOD, logarithm of the odds.

