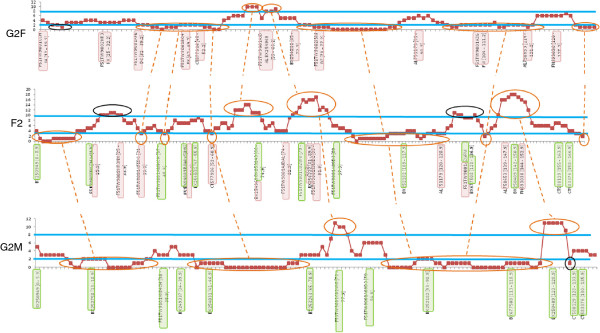
Figure 4.

Representation of marker density for linkage group #3 of the G2F, G2M and F2 maps, highlighting recombination coldspots and hotspots [see Additional file10for the whole map]. Marker density was determined by shifting the interval along the map in 1 cM increments. The horizontal lines indicate the lower and upper thresholds defining a gene cluster or a gap. x-axis: map distance over the whole linkage group (marker position is as in Additional file 3, with common markers highlighted in green (between G2F and F2) and pink (between G2M and F2), and enclosed in squares for markers common to G2F, G2M and F2). y-axis: number of genes in the interval. Clusters common to the F2 map and at least one G2 map are indicated by orange circles connected by dotted orange lines. Clusters common to the G2F and G2M maps are indicated by black circles connected by dotted black lines. Clusters observed on only one map are indicated by black circles.
