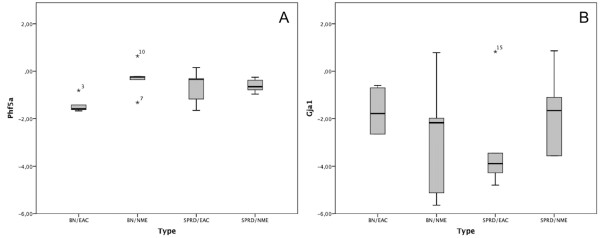
Figure 1.

Gene expression of Phf5a (A) and Gja1 (B) in NME and NUT rat cell lines. Gene expression of (A) Phf5a and (B) Gja1 in rat endometrial adenocarcinoma and pre-malignant endometrial cell lines. The bars represent the mean delta delta Ct value in each group. The median in each group is represented by horizontal line.
