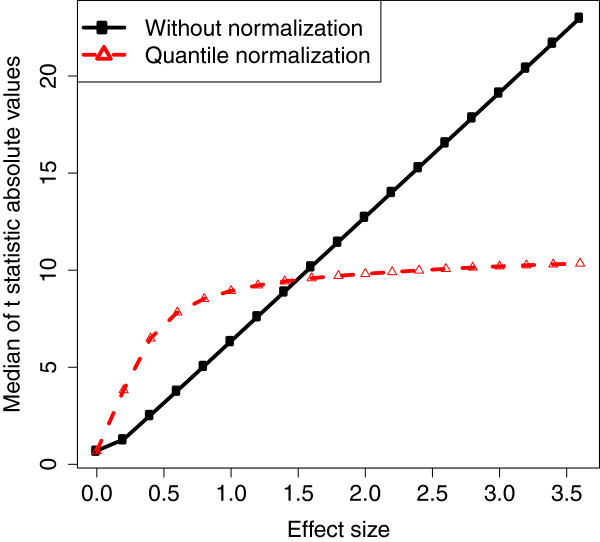
Figure 2.
Medians of the t-statistic absolute values. Medians of the absolute values of the t-statistics for data with and without quantile normalization. Gene expression are simulated by using normal random numbers with standard deviation 0.35 and gene-gene correlation 0.9. Total number of genes is m = 1000. Total numbers of truly differentially expressed genes are for up-regulated genes and m1- = 40 for down-regulated genes. The sample size is n = 10 and the true effect size is e+ = -e- = e = {0,0.2,0.4, …,3.6}. Estimates are based on 200 repetitions.

