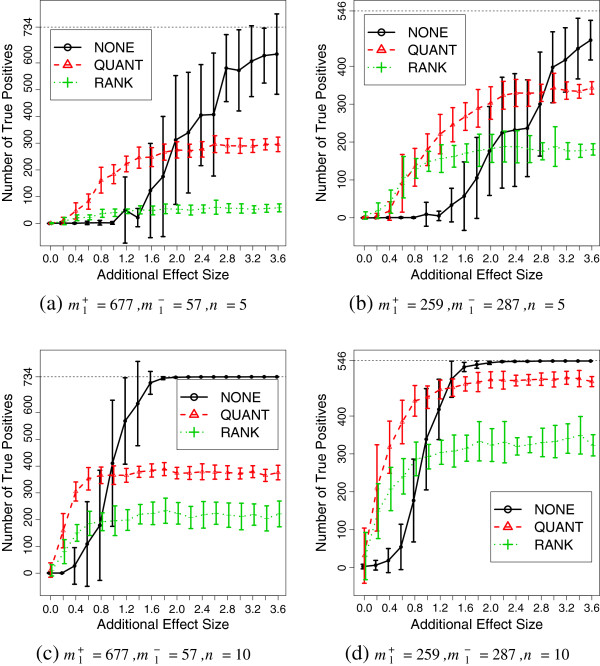
Figure 4.
Simulation results (SIMU-BIO). Average number of true positives as functions of effect size for SIMU-BIO. The error bar represents one standard deviation above and below average. Total number of truly differentially expressed genes is with m1+ up-regulated and m1- down-regulated genes, respectively. Data replicates: 20.

