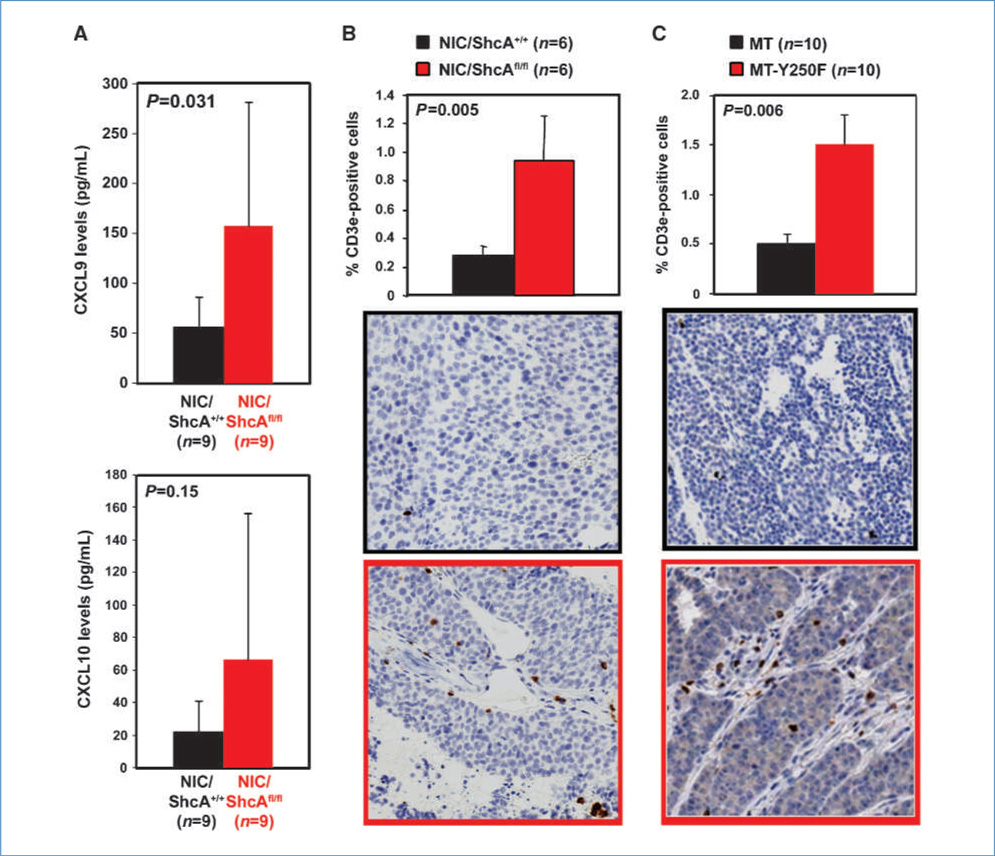
Figure 2.
Increased T-cell infiltration in NIC/ShcAfl/fl and MT-Y250F tumors. A, relative CXCL9 and CXCL10 levels, as determined by ELISA, in lysates from NIC and NIC/ShcAfl/fl tumors. B and C, immunohistochemical staining of tumors with a CD3e-specific antibody. Data are representative of 6 (B) or 10 (C) tumors (10–20 fields per tumor) and are depicted as percentage of CD3e+ cells ± SE.

