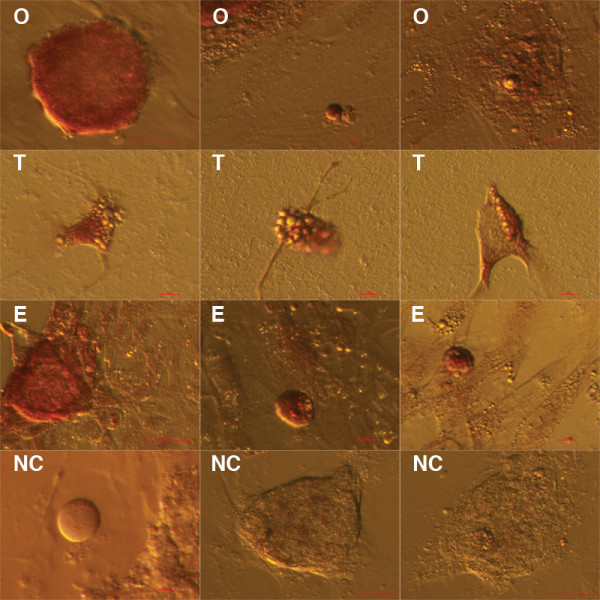
Figure 10.

A proportion of cell colonies and small putative stem cells in ovarian (O), testicular (T) and human embryonic stem (E) cell cultures were VASA-positive in comparison with negative controls (NC) under an inverted microscope. Scale bars: 50 μm and 10 μm.
