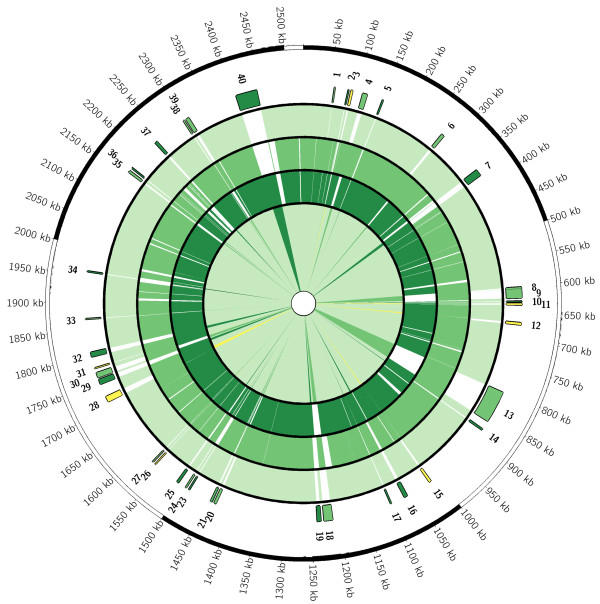
Figure 2.
Circular map comparing sequenced avian source P. multocida strains. Scale is presented in kb. The outermost rings depict genomic regions not present in strain Pm70 but present in strains P1059 (light green), X73 (dark green), or both (yellow). Regions are numbered as described in the Tables. The next three rings depict the shared genomic regions of avian source strains Pm70 (outer ring), P1059 (middle ring), and X73 (inner ring). Colored regions depict regions present at greater than 90% nucleotide similarity and non-colored regions depict regions absent. The innermost ring again depicts the core (very light green) regions present in all three strains and the regions absent from strain Pm70 but present in other sequenced strains using the same color scheme.

