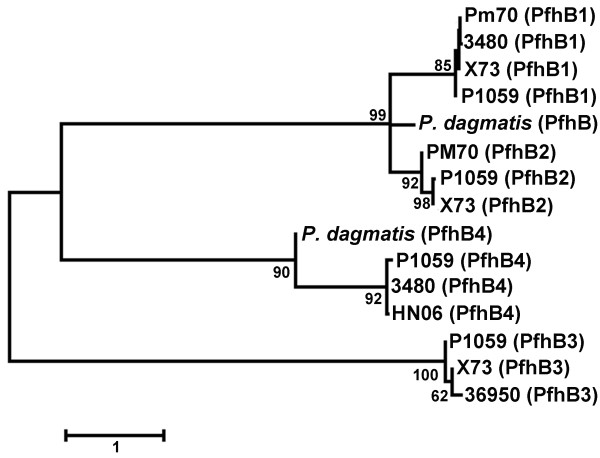
Figure 3.
Dendrogram depicting amino acid sequence similarities between the filamentous heagglutinins of Pasteurella multocida. Evolutionary history was inferred using the Maximum Likelihood method based on the JTT matrix-based model. The tree is drawn to scale, and 500 bootstrap iterations were performed. A total of 1,479 positions were used in the final dataset. The analyses were conducted in MEGA [Tamura et al. 2007]. Proteins from P. dagmatis were included for comparative purposes.

