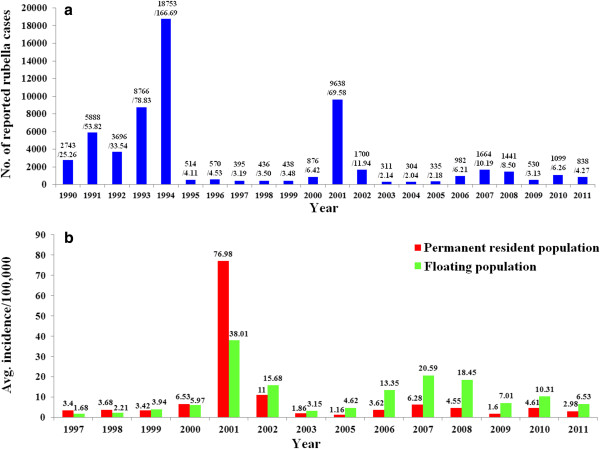
Figure 1.
Reported rubella cases in Beijing, China since 1990. (a) Total rubella cases and the incidence rate in Beijing by year of onset, from 1999 to 2011. The numbers above the bars represented the number of reported rubella cases / the incidence rate. (b) Comparison of the rubella incidence rate between the permanent resident and floating populations by year of onset, from 1997 to 2011. Data pertaining to the rubella incidence rate of the permanent resident and floating populations in 2004 were not available.

