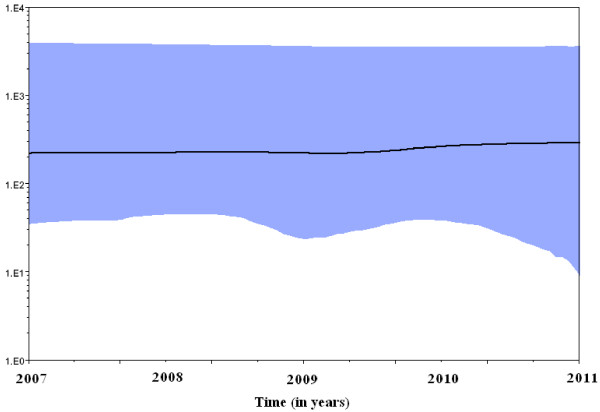
Figure 5.
Bayesian skyline plot obtained by analyzing the 16 genotype 1E rubella virus sequences. Ordinate: the number of effective infections at a given time; abscissa: time (in years). The thick solid line represents the median, while the blue area represents the 95% highest posterior density of the number of effective infections at the time estimates.

