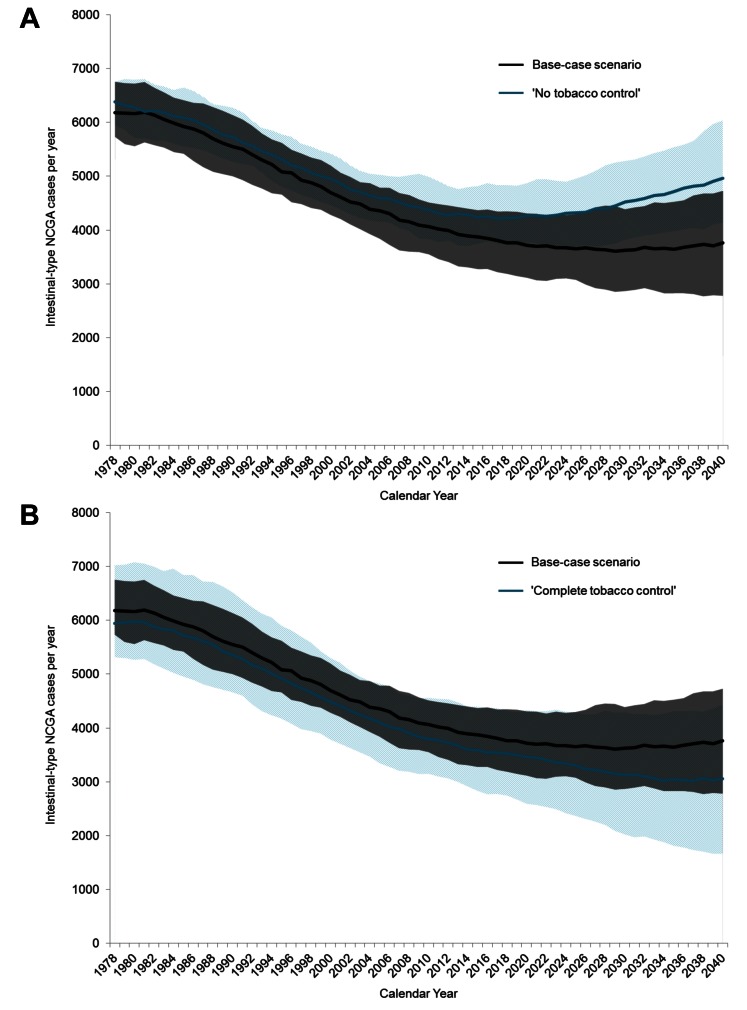
Figure 5. Modeled annual intestinal-type NCGA cases between 1978 and 2040 for select scenarios.
These figures show the number of annual incident intestinal-type NCGC cases. Mean (solid line) and range (shaded area) among the 50 randomly selected good-fitting parameter sets are shown. (A) Cancer cases for the base-case scenario (black) and “no tobacco control” scenario (light blue). (B) Cancer cases for the base-case scenario (black) and “complete tobacco control” scenario (light blue). Ranges were calculated across all 50 parameter sets and smoothed with a 3-y moving average.

