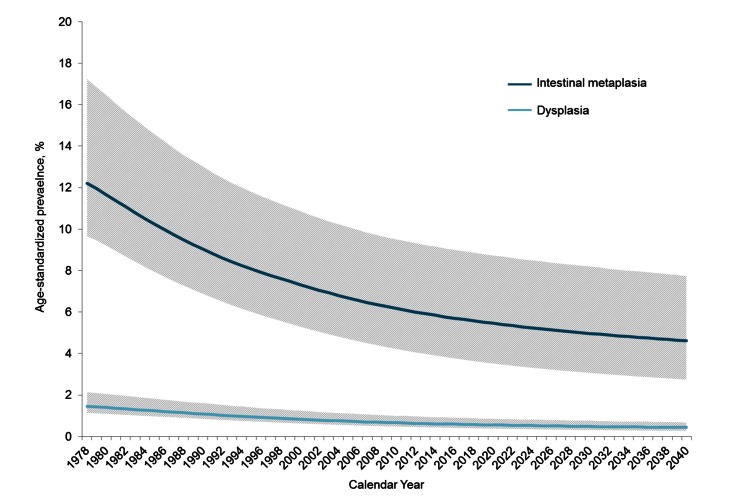
Figure 6. Age-standardized prevalence of precancerous lesions between 1978 and 2040.
For individuals 20 y and older, age-standardized prevalence of intestinal metaplasia (dark blue) and dysplasia (light blue) are shown in this graph. Mean (solid line) and range (shaded region) among the 50 randomly selected good fitting parameter sets are shown to reflect the impact of natural history uncertainty on prevalence estimates.

