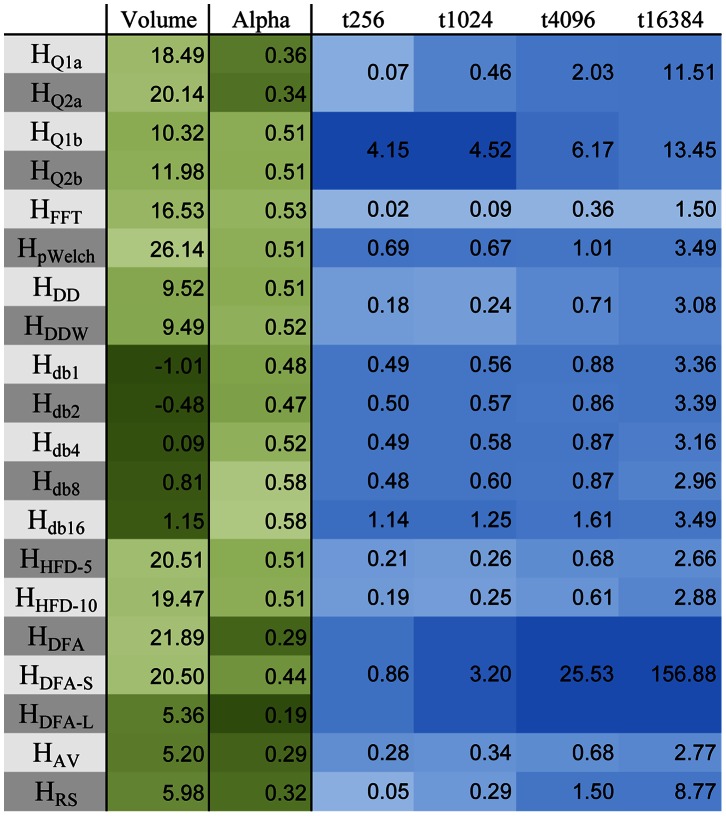
Figure 4. Comparison of Hurst estimates of simulated data.
Volume under the surface of Figure 2 , error drop-off rate alpha of Figure 5 , and computation time (in seconds) for 1000 time series of length 256, 1024, 4096, and 16384 points. The computations, optimized using MATLAB Parallel Computing Toolbox, were performed on a quad-core Intel i7-960 @ 3.6 GHz.

