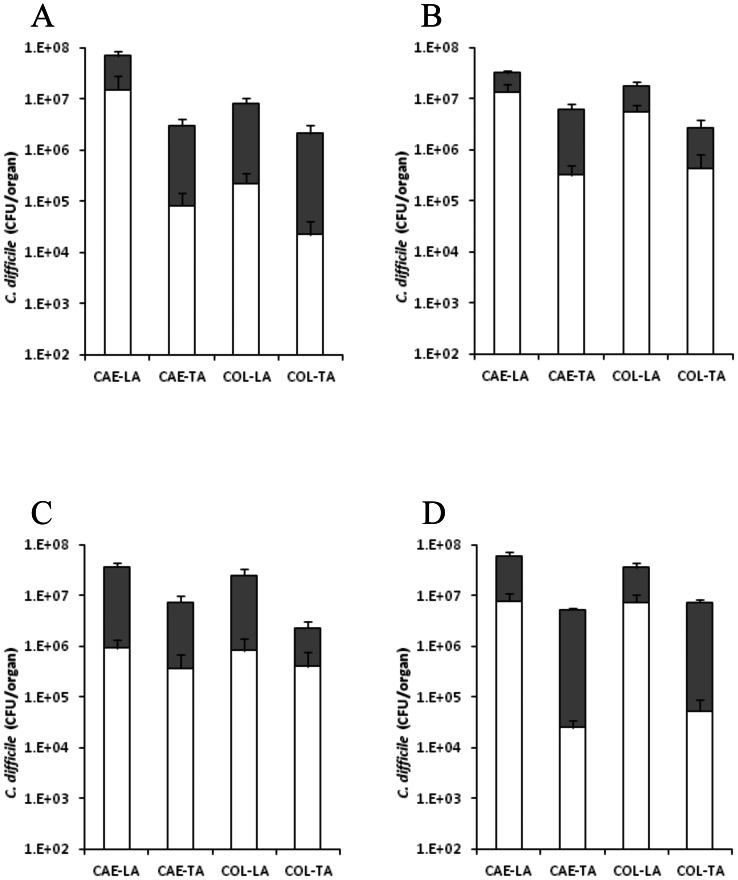
Figure 4. Colonisation kinetics of C. difficile M68 in hamsters.
To monitor colonisation throughout the infection process hamsters were culled at 1- (A), 3- (B) and 11 (D) days post challenge and if animals succumbed to infection (C). C. difficile was recovered from the caecum (CAE) and the colon (COL) either associated with the lumen (LA) or the tissue (TA). Filled bars represent vegetative bacteria whilst empty bars indicate bacteria in spore form. Bacterial recoveries represent the geometric mean plus the standard error of the mean (SEM) of 2 biological replicates, where a total of at least 5 animals were used per time interval.

