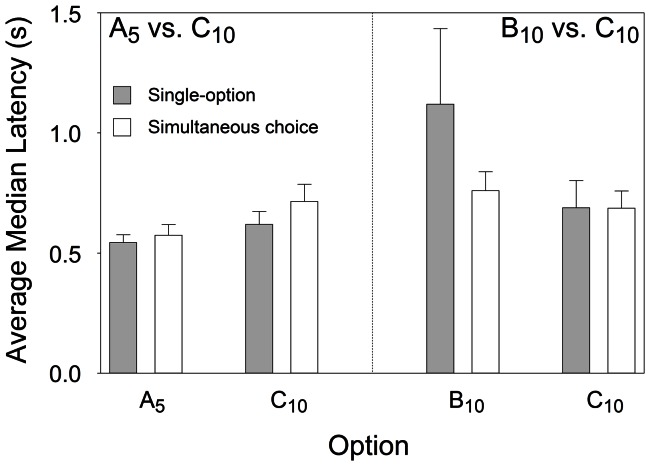
Figure 7. Latencies to accept each option in single-option and simultaneous choice trials.
Latencies are separated according to collection time: either at stability in the A5 vs. C10 preference tests or at stability in the B10 vs. C10 preference tests. Grey and white bars present median latencies averaged across subjects (+SE) from single-option and simultaneous choice trials, respectively.

