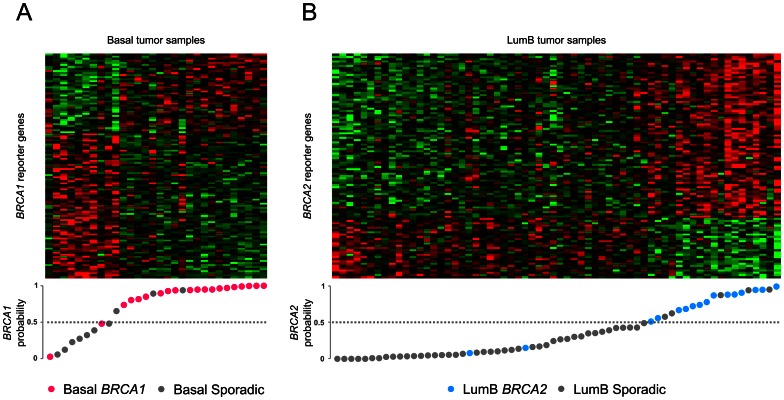
Figure 3. Within-subtype classification of basal BRCA1 and lumB BRCA2 breast cancers.
Expression data matrix of the 110-gene basal BRCA1 signature (A) and the 100-gene lumB BRCA2 signature (B) are visualized as heat maps. Rows correspond to genes and columns to samples. Tumors are ordered according to their BRCA1/2 probability estimate obtained by leave-one-out cross-validation (lower panels). The germline mutation is shown as red (BRCA1), blue (BRCA2) or grey (sporadic). Dashed lines indicate the BRCA1/2 probability cutoff. Samples with probabilities ≥0.5 are classified as BRCA1/2, while samples with probabilities <0.5 are classified as sporadic tumors.

