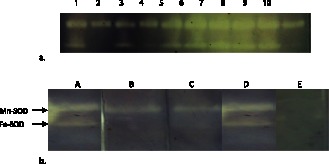
Figure 1. Zymogram analysis of superoxide dismutases:

(a) Representative zymogram showing two acromatic bands of crude bacterial lysate from Yersinia spp. (b) Effect of different inhibitors on SOD isoforms of Y. enterocolitica. Lane A: Cell lysate without inhibitor; B: with 5 mM H2O2; C: with 5 mM NaN3; D: with DDTC; E: with chloroform:ethanol.
