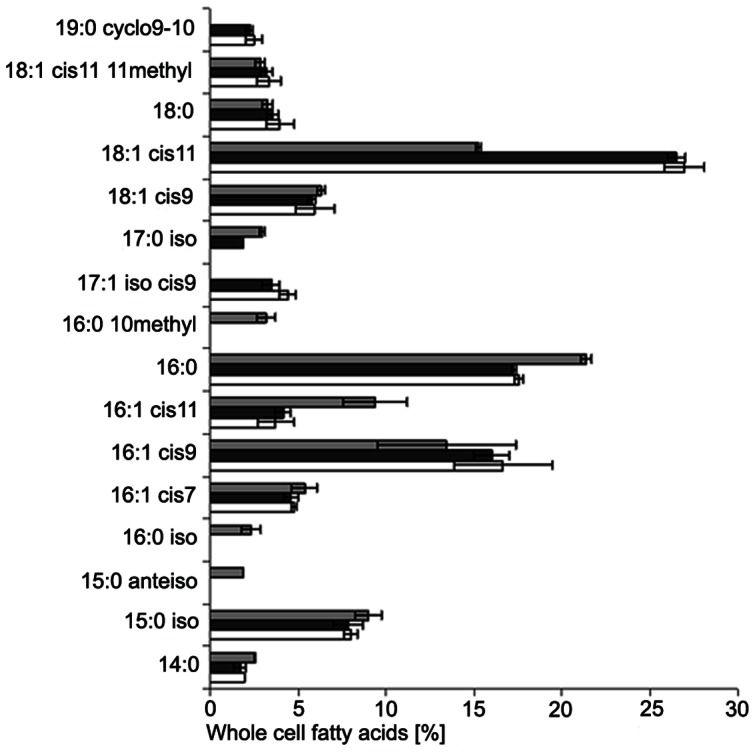
Figure 1. Whole fatty acid profile of the three original biofilter samples.

Samples from the moving-bed biofilters were analyzed in parallels (error bars represent the standard deviation of n = 2 samples of each moving-bed system). Data from the barramundi biofilters are shown by white and black bars (white and black biocarriers), and those from the shrimp biofilter by grey bars.
