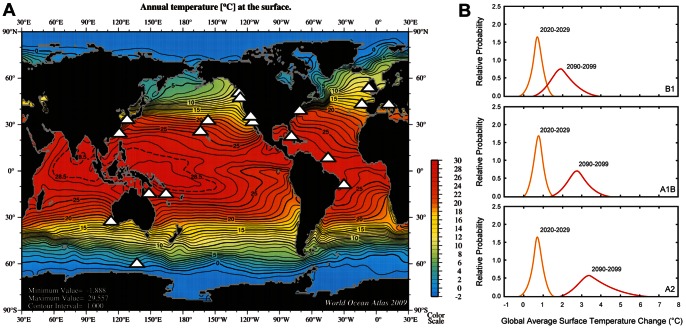
Figure 1. Summary of the locations at which the species/strains were initially isolated.
A) Overlaid (locales denoted by white stars) on a global map of satellite sea surface temperature (°C, from World Ocean Atlas, [91]); B) Projected surface ocean temperature changes for the early and late 21st century relative to the period 1980–1999. The global average surface ocean temperature change is plotted against the relative probabilities of estimated global average warming from several different AOGCM and Earth System Model of Intermediate Complexity. The data are for average projections for the B1, A1B, and A2 SRES scenarios. Plot is from IPCC AR4 [104].

