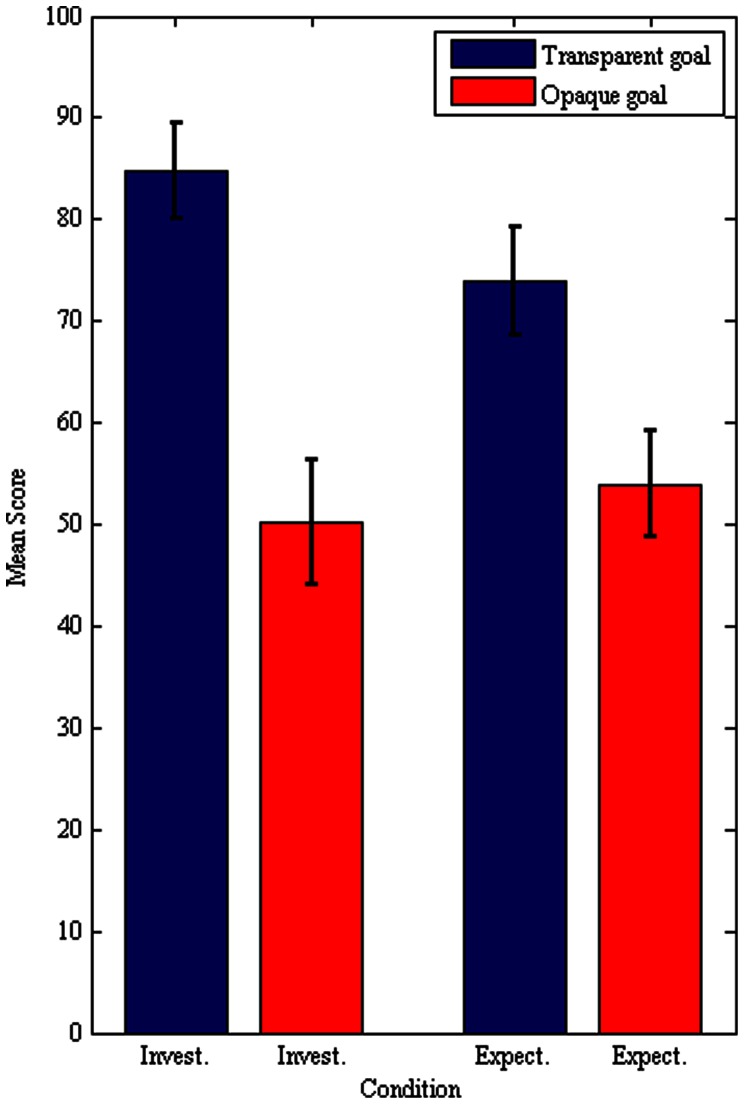
Figure 3. Investments and expectations in the public goods game.
Each observation represents the amount invested or expected to be invested. Participants in the transparent condition show significantly higher investment levels, and subsequently higher expectations about the investment of the other player (n = 48).

