
FIGURE 3.
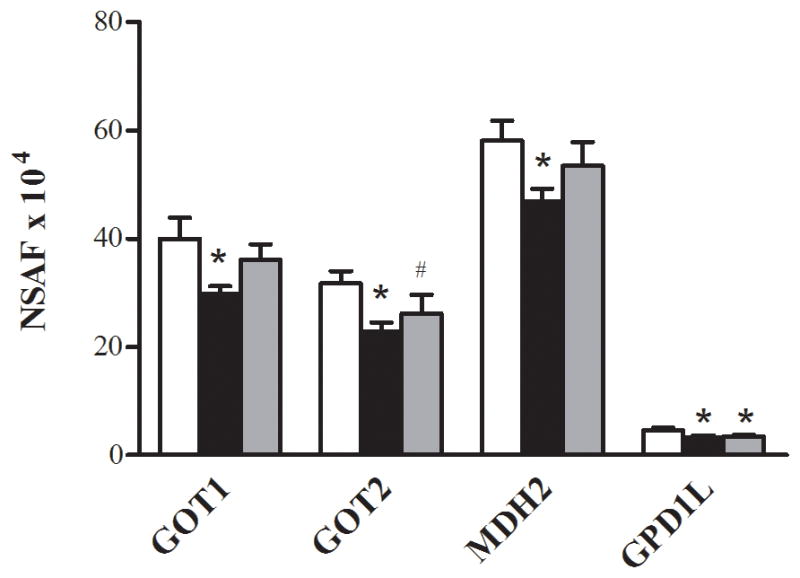
Proteins of the NADH shuttles. Relative changes in the abundance of proteins of the NADH shuttles in the control (□), T2D Pre (■), and T2D Post (■). The data are means ± SEM (n = 6). *Significantly different from the control, P< 0.05. #Significantly different from T2D Pre, P< 0.05.