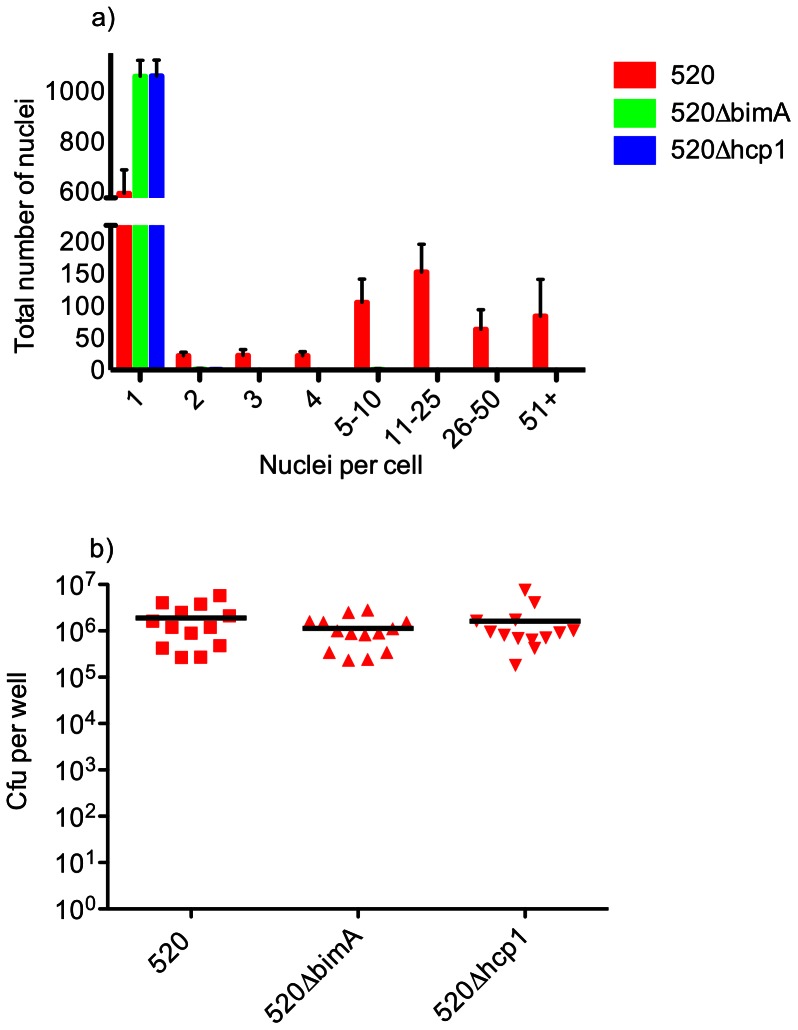
Figure 1. Infection of RAW264.7 cells by B. pseudomallei MSHR520, MSHR520ΔbimA, and MSHR520Δhcp1.
Infections were carried out over a period of 12 h and fixed for Giemsa staining (a) or lysed to release internalised bacteria, which were then plated for enumeration of cfu per well (b). (a) Formation of MNCs in cells infected with ΔbimA and Δhcp1 mutants as compared with wt (MSHR520). Comparisons between mutants and wt were statistically significant (P<0.001). >1000 nuclei per well were counted and are expressed as number of nuclei in each category. Columns show the mean values with SEM. (b) Intracellular bacteria in cells infected with wt, ΔbimA and Δhcp1 mutants as compared with wt (MSHR520). No significant difference (P = 0.46) is observed between wt and ΔbimA or wt and Δhcp1. Scatter plots show each well as an individual point with the mean value represented by the horizontal bar. Data are derived from 4 separate experiments, each including duplicate or triplicate wells.

