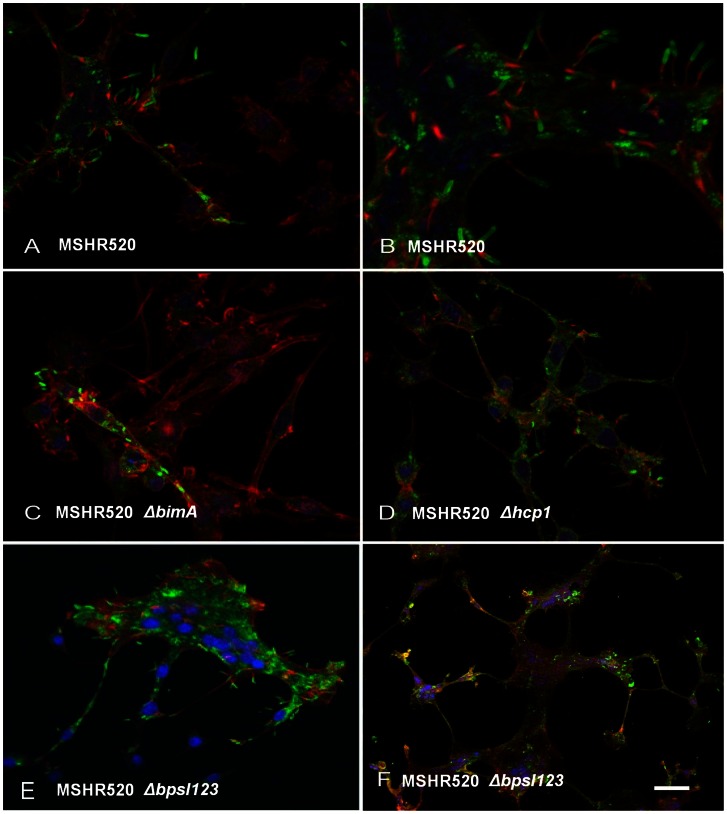
Figure 3. Representative views of B. pseudomallei infected RAW264.7 cells at 12 h post infection.
A) & B) MSHR520 (wt) infected; C) MSHR520 ΔbimA; D) MSHR520 Δhcp1; E) & F) MSHR520 ΔbpsI123. Nuclei are stained blue with DAPI; bacteria are labelled green with rabbit anti-B. pseudomallei IgG and anti-rabbit IgG-alexa 568; and actin is labelled red with phalloidin-alexa 488. Red actin tails, at the poles of bacteria, are visible in all panels with the exception of C. Scale bar represents 25 µm (A, C, D, E), 12.5 µm (B), 250 µm (F).

