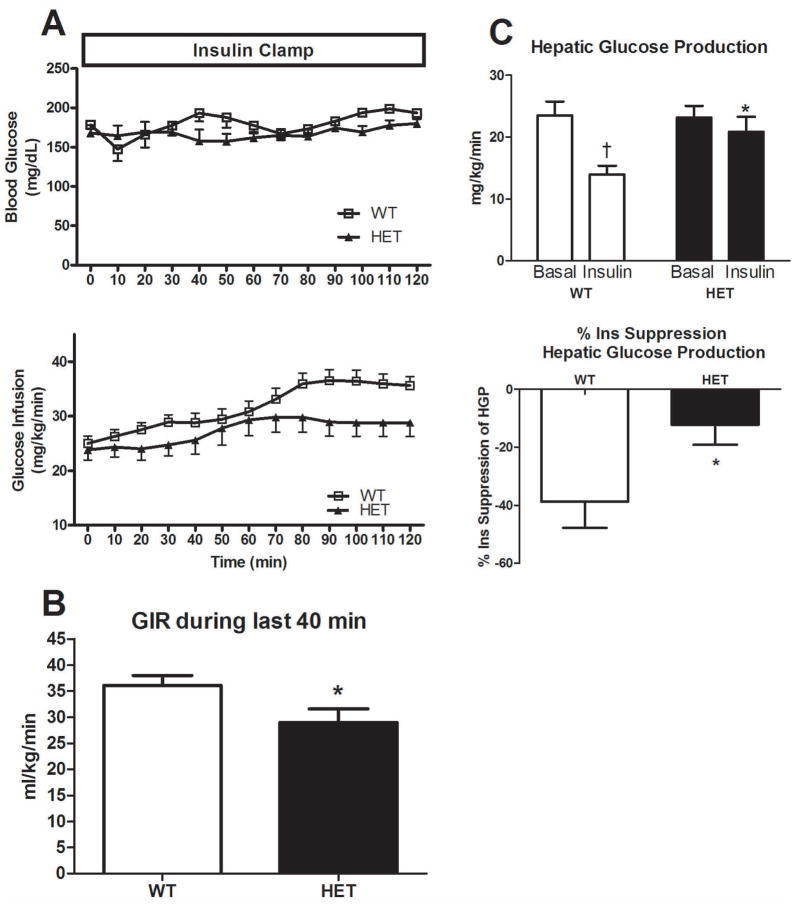
Figure 2.
Hyperinsulinemic-euglycemic clamp data in HET MTP and WT mice. Blood glucose levels and glucose infusion rate to maintain euglycemia (Figure 2A), average glucose infusion rate during the final 40 minutes of clamp (Figure 2B), hepatic glucose production during the basal and insulin stimulated conditions and percent insulin suppression of hepatic glucose output during the clamp (Figure 2C). Values are means ± SE (n=6–8 per group). * Significantly different than WT, p<0.05. † Significantly different from basal, p<0.05.

